PROJECT TIMELINE
GOALS AND OBJECTIVES
Quarter 4, 2016
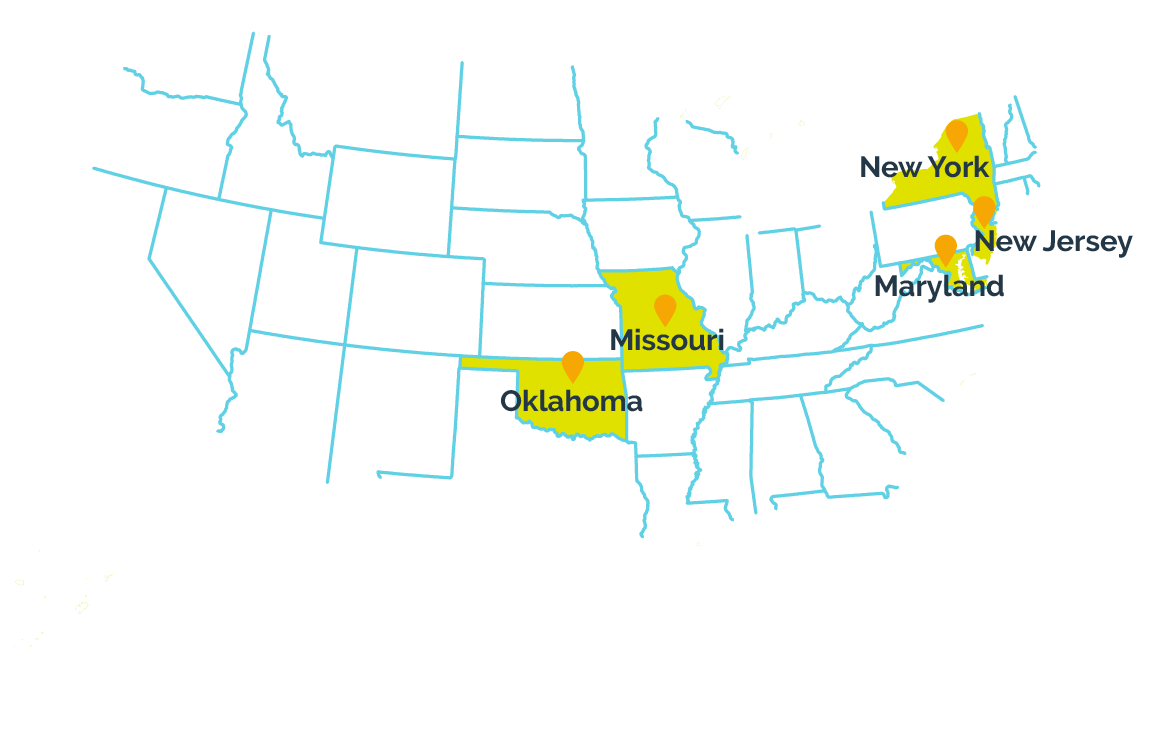
The I-SMART project was awarded a 4-year, $3.8 million Enhanced Assessment Grant from the U.S. Department of Education’s Office of Elementary and Secondary Education.
Quarter 1, 2017
We will prep for the major work of the I-SMART project by assessing our existing science learning map model to see where we need to expand its content. We will also review key academic literature on topics of assessment design, universal design for learning, and how students learn science concepts.
Quarter 2, 2017
We will officially kick off the I-SMART project by convening our governance board. We will continue these quarterly meetings through the end of the project.
Having reviewed our existing science maps, I-SMART staff at AAI will begin expanding them into the 11 science maps that will become the foundation of this project. The maps’ content will build on models that are part of the Dynamic Learning Maps® and Enhanced Learning Maps projects.
Meanwhile, project partners at CAST will begin gathering information from teachers from our partner states about what information they would like to see on reports about their students’ performance on science assessments.
Quarter 3, 2017
We will continue to refine our science learning map models in order to help teachers and test makers see the prerequisite knowledge necessary to understand each concept, as well as to see how students who have mastered certain content can progress to other material. We will also connect our science maps to established learning map models in ELA, math, and pre-academic foundational skills, which were produced by the Dynamic Learning Maps® and Enhanced Learning Maps projects.
Once we have completed initial drafts of our map models, we will convene a meeting of educators and content experts from each of our partner states and use their guidance to make final revisions.
Our user-interface designers will begin developing a prototype dashboard that teachers can use to see how students performed on assessments that we will develop later in the project. The prototype will be guided by information from the interviews we conducted with teachers in the previous quarter.
Quarter 4, 2017
After finalizing the learning map models that will serve as the basis for our science assessments, we will draft guides for test developers that illustrate the content to be included in our assessments, including levels of mastery leading up to each concept and common misconceptions students may have about a concept.
Then we will create prototypes of three short science assessments designed for students with significant cognitive disabilities and students not meeting grade-level expectations. These tests will represent three different levels of mastery at three different grade bands, 3-5, 6-8, and high school.
Our user-interface designers will continue refining the dashboard prototype in order to achieve the best possible user experience and provide the most useful information for teachers.
Quarter 1, 2018
As we enter the second year of the project, we will finalize prototypes of three short, computer-based science assessments. We will also begin planning labs to test the assessments with real students.
Following the conclusion of the labs, we will also begin developing the technology necessary to administer our prototype assessments to thousands of students via a pilot study.
Quarter 2, 2018
In the spring of 2018, we will begin conducting labs with students to evaluate our assessment prototypes for their accessibility, straightforwardness, and effectiveness. We will use the results of these labs to make any final modifications necessary.
We will also begin designing a pilot study to test an initial collection of science assessments with a large group of students from our partner states. We will use the pilot study to evaluate the effectiveness of the assessment questions.
Quarter 3, 2018
By the fall of our second year, we will put the finishing touches on the plans for our pilot study and the technology necessary to deliver administer assessments to students.
We will also produce technical reports related to the assessment creation, delivery, and reporting processes that we’ve developed so that other states and organizations may learn from our work.
Quarter 4, 2018
Toward the end of 2018, we will begin piloting our new assessments with students who have cognitive disabilities and low-achieving students without disabilities across our partner states. The pilot study will give us critical information about the usability and feasibility of our assessments, as well as provide information to assess the utility of the science learning maps models.
As different schools across our partner states finish administering the pilot assessments, we will conduct surveys with educators about their students’ experiences with the assessments.
Quarter 1, 2019
As I-SMART begins year three, we will continue working through our pilot study using the tests that were created in the prior year.
As more schools conclude pilot testing, we will continue interviewing teachers to see what they thought about the tests and to ask about their experiences administering the tests.
Quarter 2, 2019
We will start evaluating the results of our pilot study in the spring of 2019. We will also use data from the pilot study to examine the quality of our test questions and to build arguments for their validity in assessing student achievement.
As we process the results of the pilot study, we will also develop a mechanism to automate scoring so that our model of assessment could be easily and cost-effectively used in the future.
Quarter 3, 2019
Evaluation of our pilot study data will continue into the fall of 2019 as we review the effectiveness of our test format, the technology used to deliver the tests, and the individual questions on each test. We will take the information we gather, use it to improve our assessments, and turn the lessons we learn along the way into documentation with recommendations on how to best produce similar science assessments in the future.
Meanwhile, we will continue developing the technology necessary to automate scoring of future assessments and build a working prototype of a reporting dashboard.
Quarter 4, 2019
As we conclude the third year of the I-SMART project, we will finalize the analysis of the pilot study and review the effectiveness of our prototype reporting dashboard.
Armed with specific information about our test questions, the assessments as a whole, and the effectiveness of our learning map model at providing a foundation for rigorous alternate assessment in science, we will publish documentation about our findings. We plan to distribute those findings by publishing articles in academic journals, presenting at national conferences of researchers and educators, and through social media and the internet.
Quarter 1, 2020
With our pilot study complete and the results officially in, we will begin modifying our assessments to be more user-friendly, to address any points of confusion, and to fix any problems with test difficulty as it relates to grade level or the level of mastery we intended to assess.
We will also recruit a few teachers from each of our partner states to help us evaluate the helpfulness of our reporting dashboard.
Throughout these processes, we will continue producing technical documentation about our findings as we wrap up studying how well the assessments accurately assess students’ science skills.
Quarter 2, 2020
By spring of the project’s final year, we will put the finishing touches on the last of the modifications to our pilot assessments.
We will also finalize modifications to our reporting dashboard using the feedback from teachers we interviewed.
Quarter 3, 2020
In the fall of 2020, having concluded revisions to our assessments and reporting dashboard, we will complete the process of documenting our findings from our pilot study, our interviews with teachers, and our experiences creating these products.
We will also publish journal articles, attend conferences, and publish information through social media and the internet to disseminate the knowledge we gained through this project, so that other states and organizations may benefit from our work and use it to improve science education and assessment across the country.
Project Conclusion
The project concluded at the end of 2021. Findings from the pilot study as well as a study examining the usability and feasibility of the score-reporting dashboard are posted to our resources page along with all other products from our work.